Archivo:test cld.png
test_cld.png (610 × 432 píxeles; tamaño de archivo: 185 kB; tipo MIME: image/png)
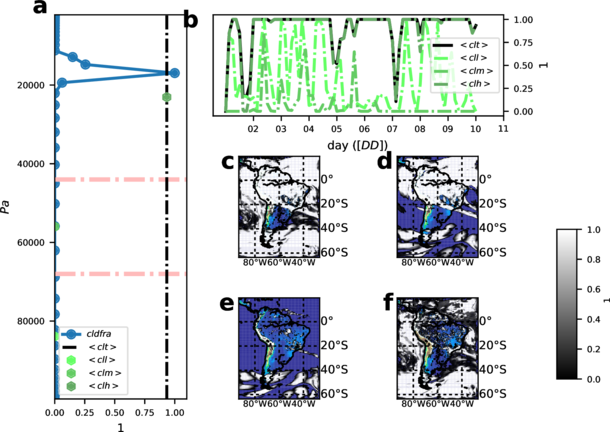
Vertical distribution of cloud fraction and the different cloud types at a given point (top left): cloud fraction ('cldfra', full circles with line in blue), mean total cloud fraction ('cltmean', vertical dashed line), mean low-level cloud fraction ('cllmean' p ≥ 680 hPa, dark green hexagon), mean mid-level (clmmean 680 < p ≥ 440 hPa, green hexagon), mean high-level (clhmean p < 440 hPa, clear green hexagon). Temporal evolution of cloud types at the given point (top right). Map of cltmean with colored topography beneath to show-up cloud extent (middle middle), map of clhmean (middle right), map of clmmean (bottom middle) and map of cllmean (bottom right)
Historial del archivo
Haz clic sobre una fecha y hora para ver el archivo tal como apareció en ese momento.
| Fecha y hora | Miniatura | Dimensiones | Usuario | Comentario | |
|---|---|---|---|---|---|
| actual | 19:56 27 feb 2019 | | 610 × 432 (185 kB) | Lluis.fita (discusión | contribs.) | |
| 19:15 23 mar 2018 | 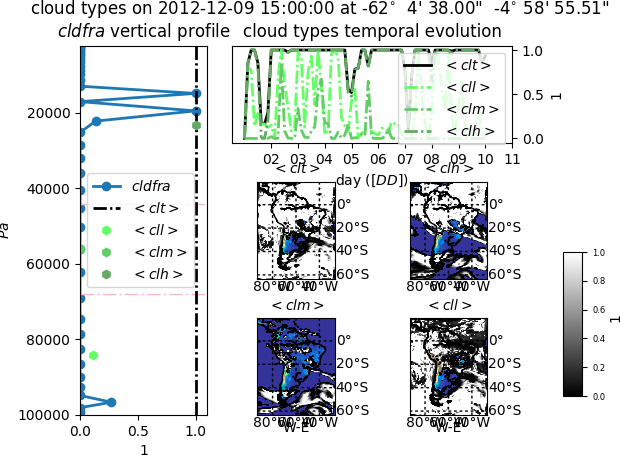 | 620 × 455 (133 kB) | Lluis.fita (discusión | contribs.) | Vertical distribution of cloud fraction and the different cloud types at a given point (top left): cloud fraction ('cldfra', full circles with line in blue), mean total cloud fraction ('cltmean', vertical dashed line), mean low-level cloud fraction ('c... |
No puedes sobrescribir este archivo.
Usos del archivo
La siguiente página usa este archivo: