Archivo:test cld.png
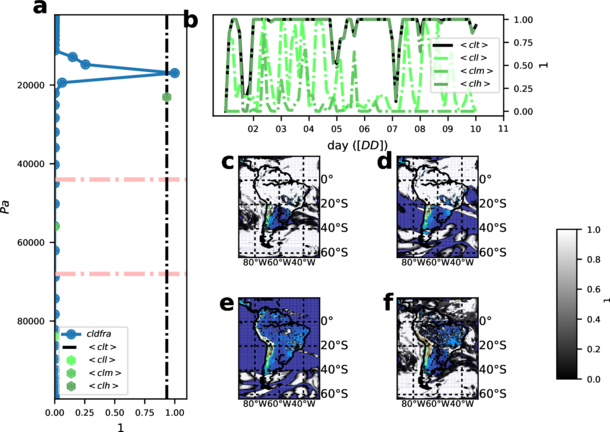
Vertical distribution of cloud fraction and the different cloud types at a given point (top left): cloud fraction ('cldfra', full circles with line in blue), mean total cloud fraction ('cltmean', vertical dashed line), mean low-level cloud fraction ('cllmean' p ≥ 680 hPa, dark green hexagon), mean mid-level (clmmean 680 < p ≥ 440 hPa, green hexagon), mean high-level (clhmean p < 440 hPa, clear green hexagon). Temporal evolution of cloud types at the given point (top right). Map of cltmean with colored topography beneath to show-up cloud extent (middle middle), map of clhmean (middle right), map of clmmean (bottom middle) and map of cllmean (bottom right)
Historial del archivo
Haz clic sobre una fecha/hora para ver el archivo a esa fecha.
| Fecha y hora | Miniatura | Dimensiones | Usuario | Comentario | |
|---|---|---|---|---|---|
| act | 16:56 27 feb 2019 | Error al crear miniatura: Unable to run external programs, passthru() is disabled. | 610 × 432 (185 KB) | Lluis.fita (Discusión | contribuciones) | |
| 16:15 23 mar 2018 | Error al crear miniatura: Unable to run external programs, passthru() is disabled. | 620 × 455 (133 KB) | Lluis.fita (Discusión | contribuciones) | Vertical distribution of cloud fraction and the different cloud types at a given point (top left): cloud fraction ('cldfra', full circles with line in blue), mean total cloud fraction ('cltmean', vertical dashed line), mean low-level cloud fraction ('c... |
- Editar este archivo usando una aplicación externa (Lee las instrucciones de configuración -en inglés- para más información)
Usos del archivo
La siguiente página enlaza a este archivo: